The Building Cost Information Service (BCIS) is the leading provider of cost and carbon data to the UK built environment. Over 4,000 subscribing consultants, clients and contractors use BCIS products to control costs, manage budgets, mitigate risk and improve project performance.
Published: 02/11/2026
EPC lodgements for new dwellings in England fell by 4% in the third quarter of 2026 compared with the same period last year, suggesting housing delivery remains subdued.
Figures published by the Ministry of Housing, Communities and Local Government(1) show that around 46,000 Energy Performance Certificates (EPCs) were lodged for new dwellings between July and September.
In the 12 months to September 2026, around 199,000 EPCs were lodged for new dwellings, a 1% increase on the previous 12 months. While the annual total remained slightly higher, the quarterly decline provides little evidence of the sustained acceleration needed to meet the government’s ambition for 1.5 million net additional homes in England over this parliament.
What the EPC figures measure
EPC lodgements provide an early indication of new housing supply, covering new builds, conversions and changes of use. Published more frequently than the annual net additional dwellings statistics, they help track delivery within the year.
However, EPC lodgements do not account for demolitions and should not be treated as a direct measure of net additional homes.
Separate housing starts and completions statistics also provide an indication of new housing supply, although they are published with a longer lag than EPC data and cover new builds only. The latest provisional figures showed 37,530 completions in England in 2Q2026, up 11.2% on the previous quarter and 1.4% on a year earlier. Housing starts reached 38,510, up 11.8% on the quarter and 20.7% on the year.
Delivery varies across regions
Six of England’s nine regions recorded fewer EPC lodgements for new dwellings in 3Q2026 than a year earlier.
Yorkshire and the Humber recorded the largest fall, at 19%, followed by the West Midlands at 15% and the East of England at 9%. Lodgements fell by 8% in both the North West and South West, and by 1% in the North East.
The South East recorded the strongest increase, at 9%, followed by the East Midlands at 4%. London was unchanged.
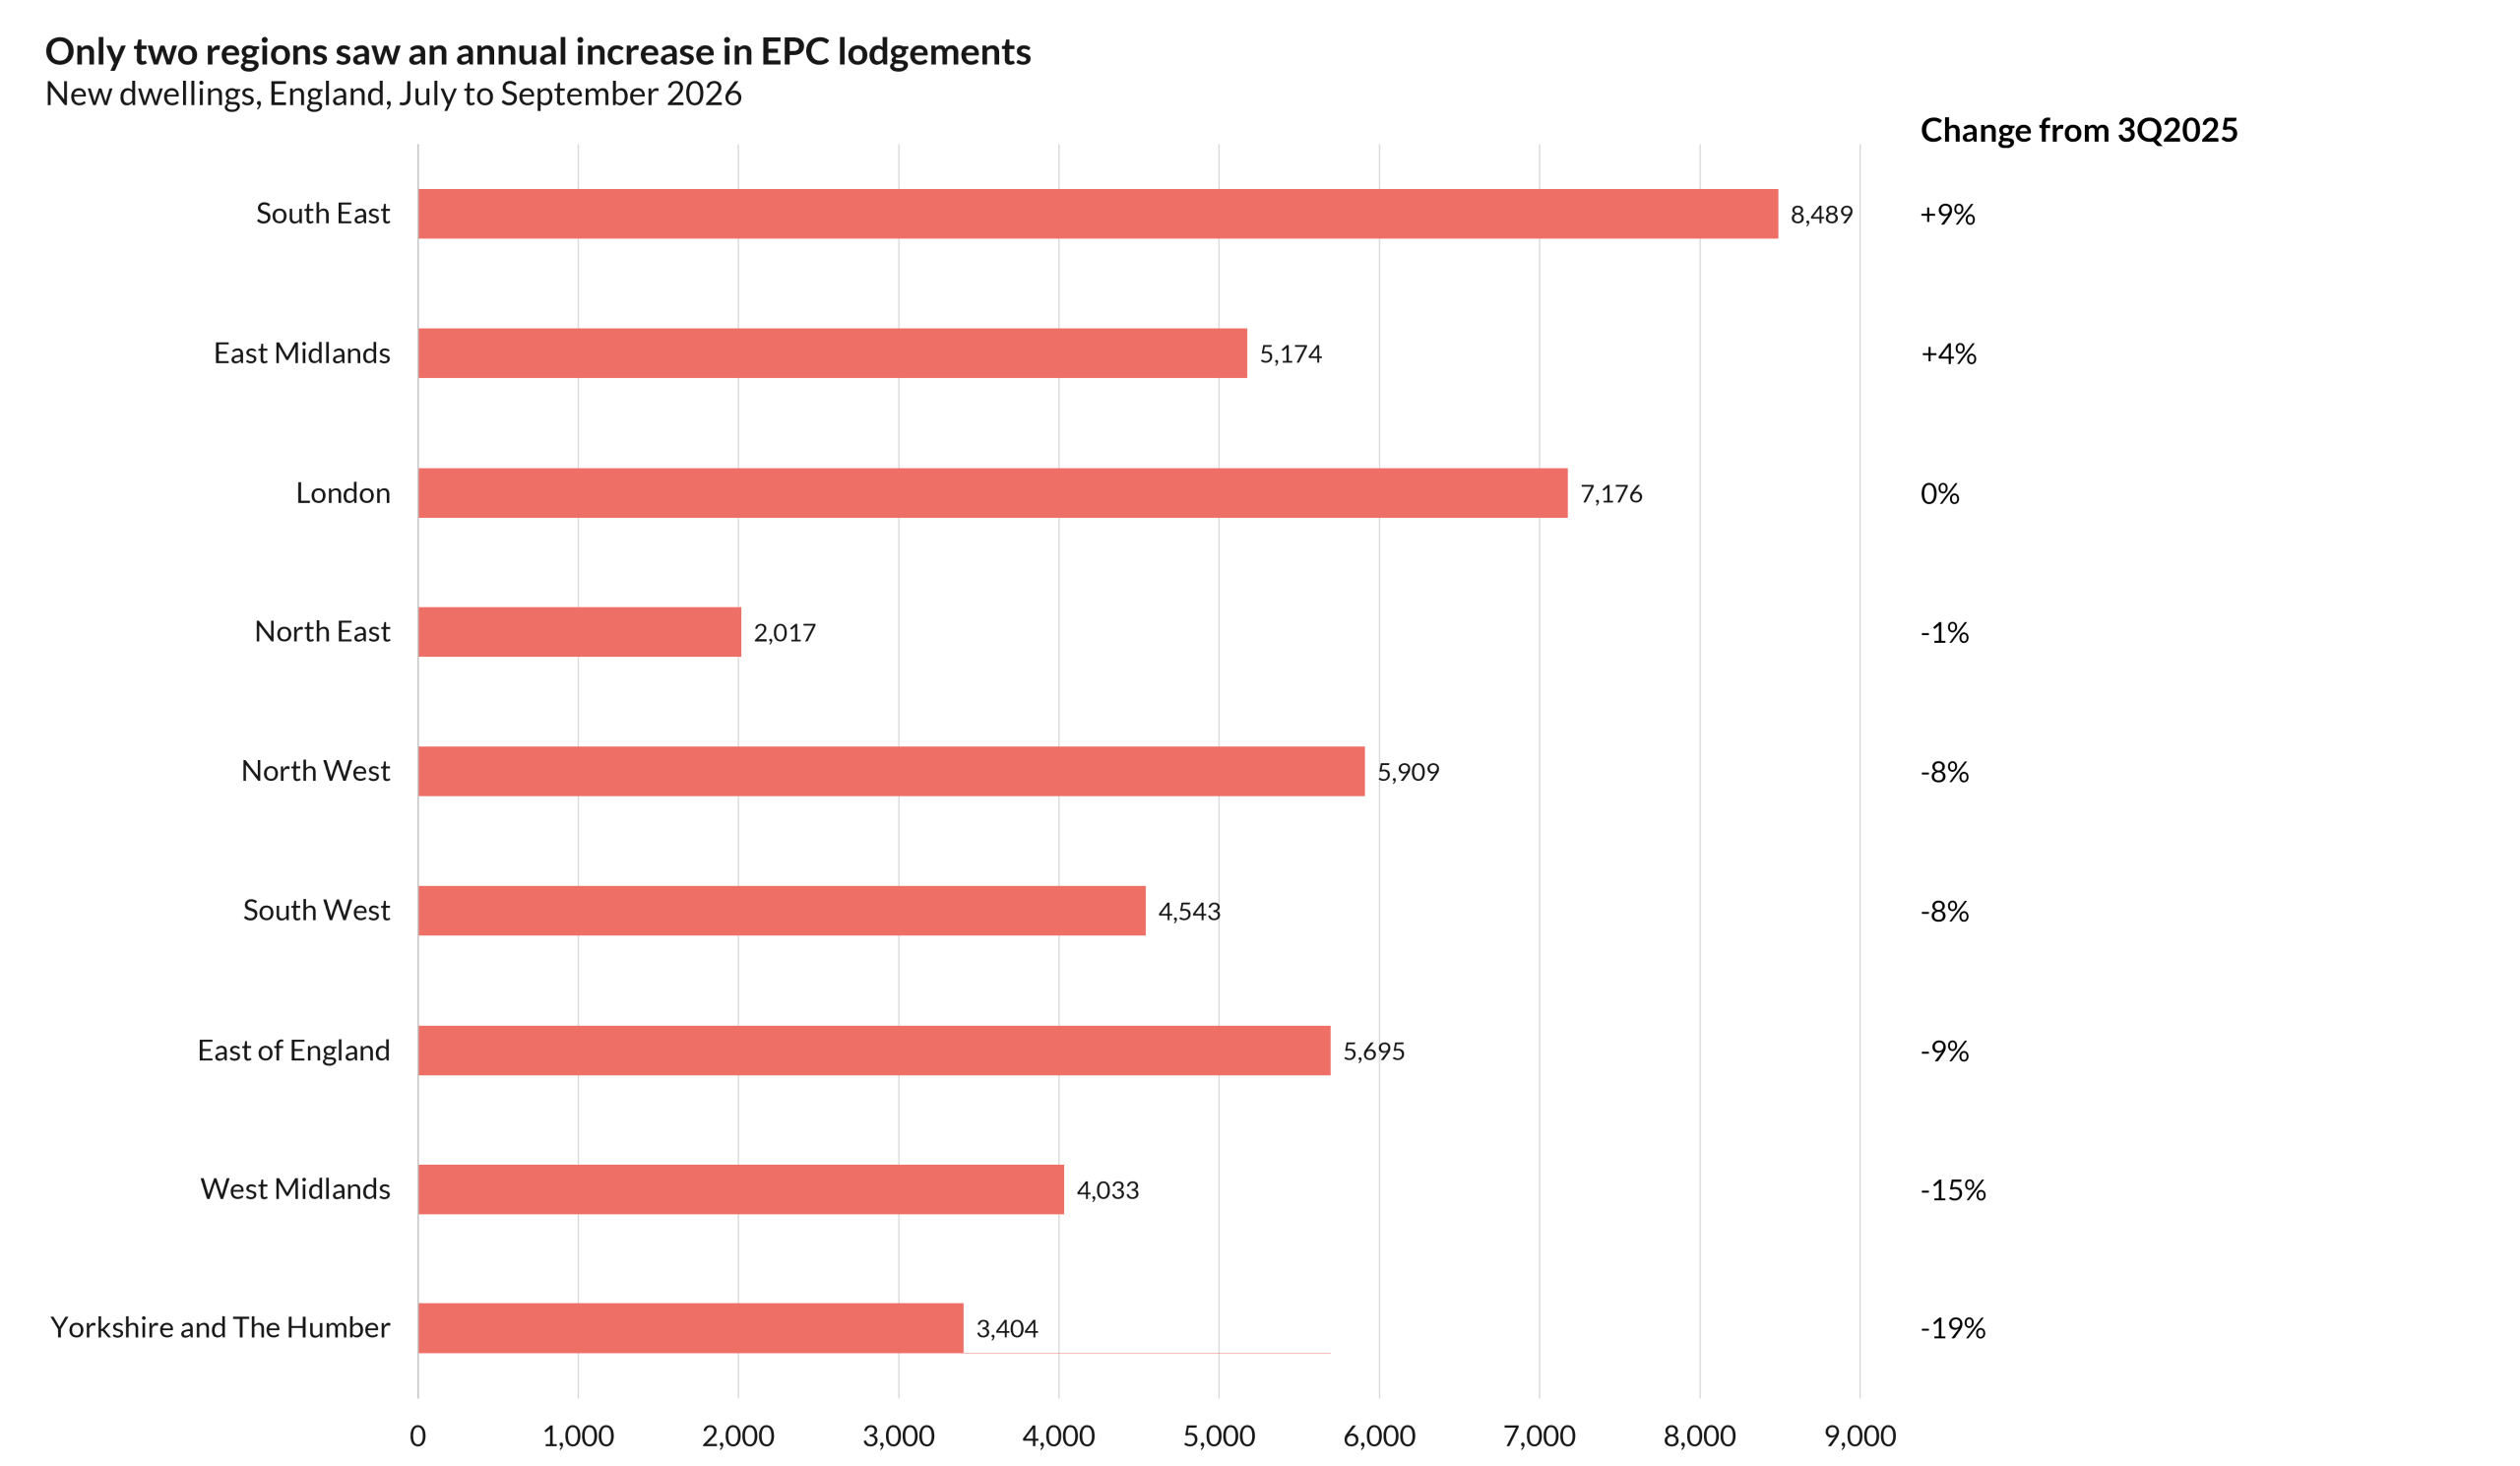
Source: Ministry of Housing, Communities and Local Government
Dr David Crosthwaite, chief economist at BCIS, said: ‘The annual total remains slightly ahead of last year, but the third-quarter decline suggests housing delivery is struggling to build momentum. Falls across six of England’s nine regions also show how widely spread that weakness is.
‘Meeting the government’s housing ambition requires a sustained increase in delivery. Planning permission is an important part of that process, but developers also need projects to be financially viable and sufficient demand to support sales.
‘Construction costs, borrowing costs and the prices buyers can afford all influence whether a development proceeds and how quickly homes are built. Where those conditions do not support delivery, an increase in the number of permissions will take longer to translate into completed homes.
‘These figures provide a timely indication of supply, but one quarter should not be read in isolation. The next releases will help show whether this decline is temporary or part of a more persistent slowdown.’
To keep up to date with the latest industry news and insights from BCIS register for our newsletter here.



(1) GOV.UK – Energy Performance of Buildings Certificates Statistical Release: July to September 2026 England and Wales – here