The Building Cost Information Service (BCIS) is the leading provider of cost and carbon data to the UK built environment. Over 4,000 subscribing consultants, clients and contractors use BCIS products to control costs, manage budgets, mitigate risk and improve project performance.
Published: 15/09/2025
UK cement production is back under the spotlight after data from the Mineral Products Association (MPA) showed production reached a 75-year low in 2024(1).
Key contributing factors, according to MPA, include high energy and labour costs as well as the UK’s growing reliance on imports.
Its executive director for cement and lime also said that without further intervention to boost domestic production, opportunities for investment, economic growth and employment will be missed.
However, the government’s vast infrastructure strategy should be positive for the industry. The main driver for production is demand and over the next five years, new work infrastructure output is forecast to grow by 18%, according to the latest BCIS Infrastructure Briefing.
Domestic producers face a tricky set of challenges, but there’s hope on the horizon yet.
Production, demand and imports
Cement, as the main binding agent in concrete, is one of the most used building materials globally.
MPA estimates as much as 750,000 tonnes of cement will be required to build Sizewell C and 8,000 tonnes for a new hospital; it’s evidently integral to the £725 billion of infrastructure work the government plans to roll out in the next decade.
A decrease in domestic production has therefore set alarm bells ringing.
Since the early 2000s, cement and clinker production in the UK have been in steady decline.
This is apparent in the Department for Business and Trade’s (DBT) bulletin on building materials and components which shows that in the 20-year period between 2004 and 2024, the production of both materials fell by more than one-third(2). This equates to a decrease of more than 4,000 tonnes per material.
The latest data on concrete block production also reflects this trend.
In July 2025, 5.16 million square metres of concrete blocks were produced in Great Britain – a decrease of one-fifth (20%) on pre-pandemic July 2019(3).
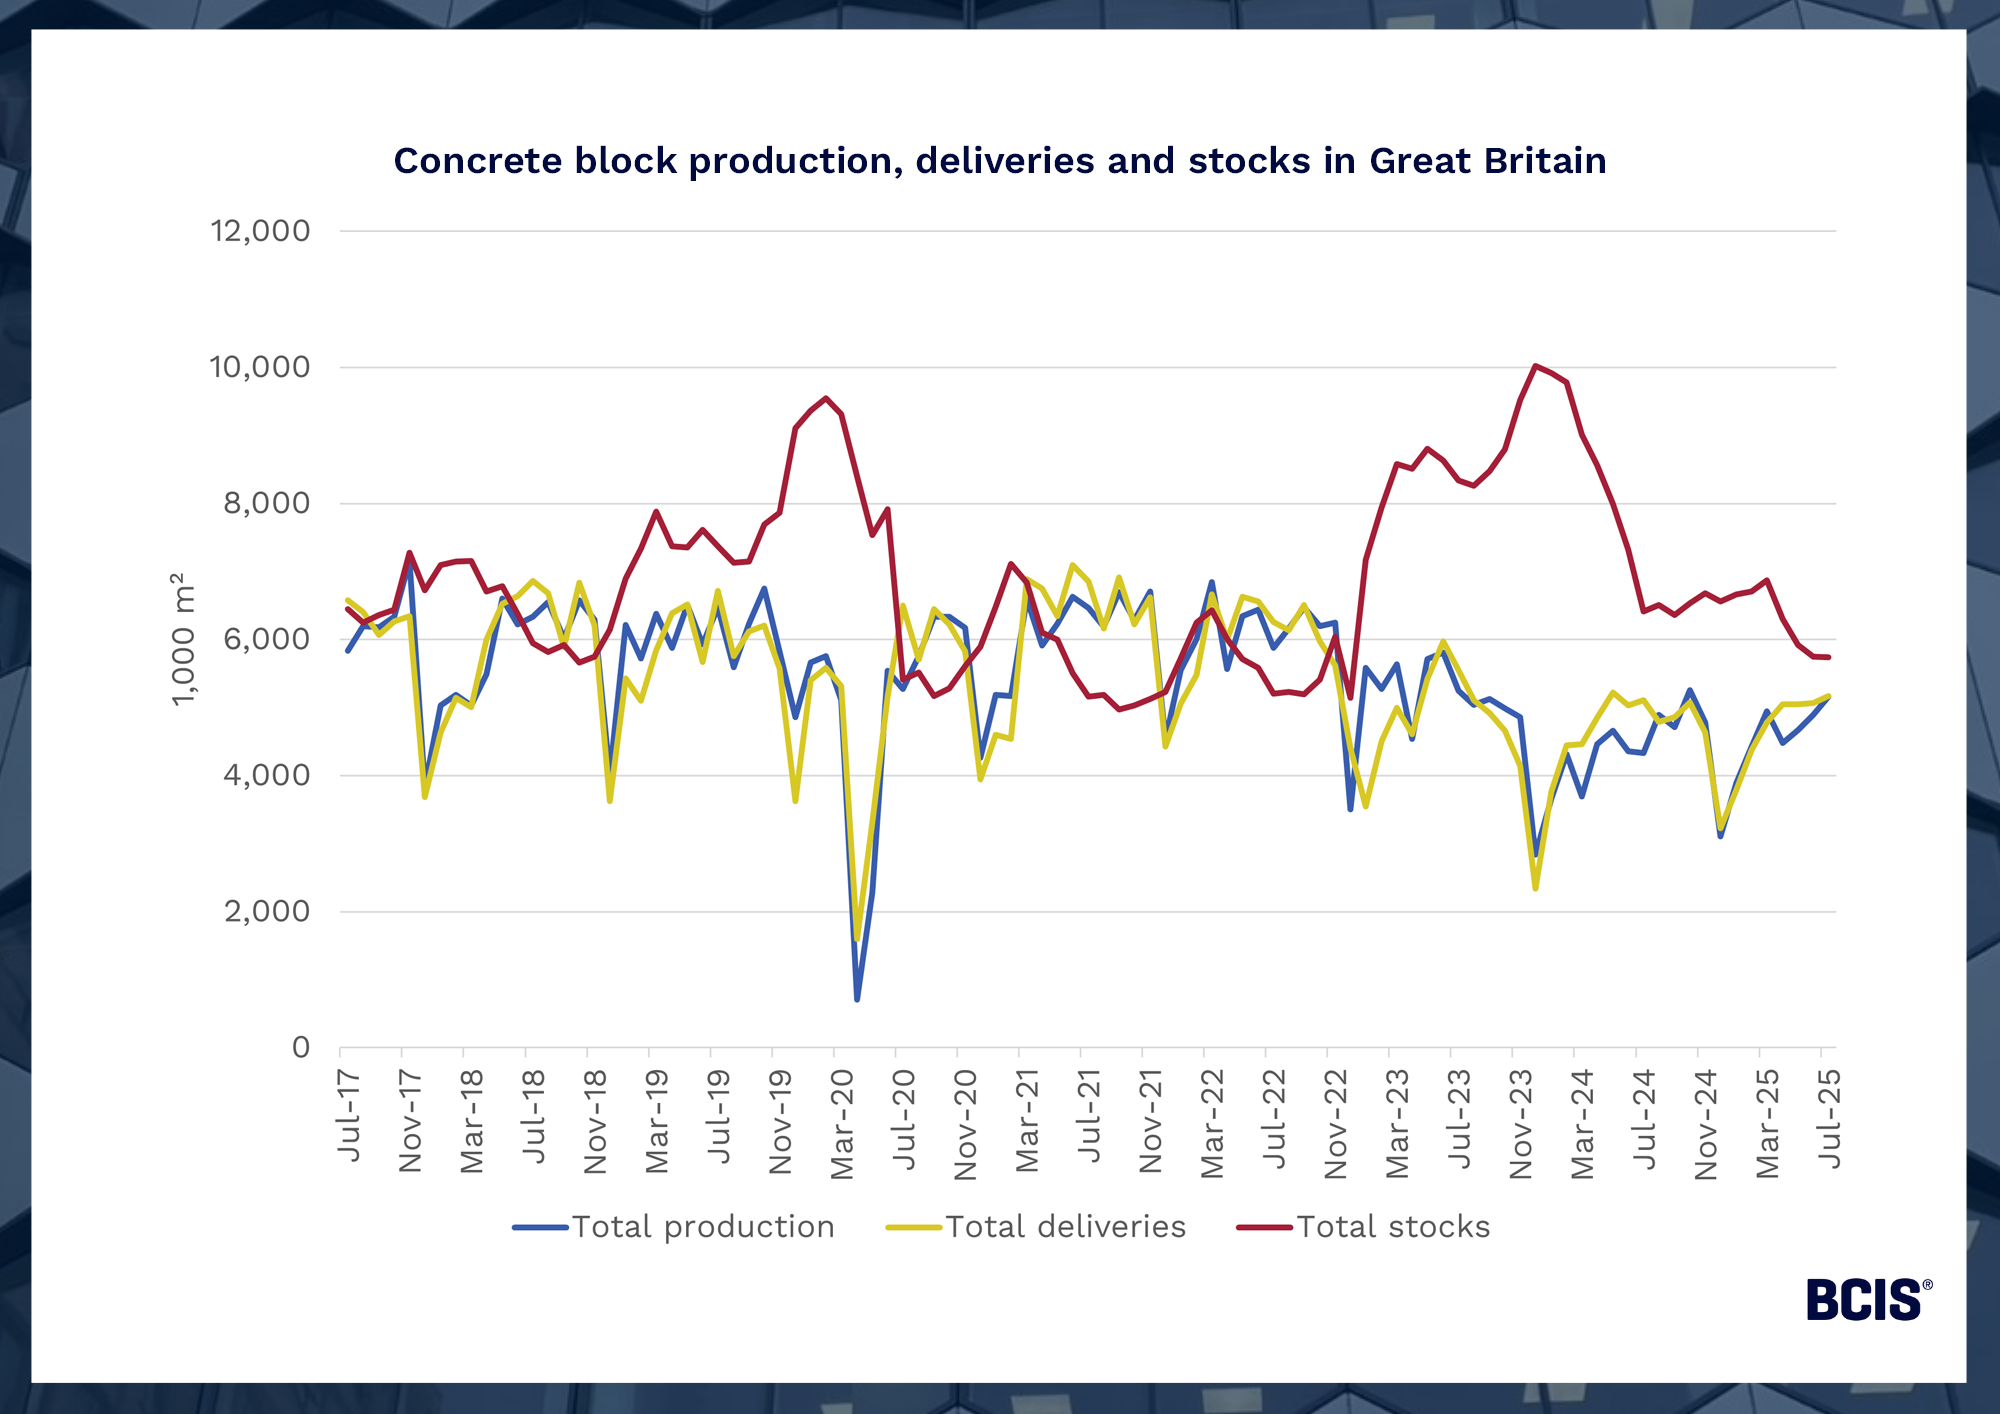
Source: Department for Business and Trade – Building materials and components statistics, Table 11a.
At first glance, the availability of the raw materials used to make concrete products doesn’t appear to be the issue. Total stocks of concrete blocks have remained higher than production or deliveries since November 2022.
The real culprits, according to multiple industry sources, include high energy costs, low demand and the knock-on effects of regulatory pressures on demand, such as Building Safety Regulator approval delays.
While construction activity is ticking over, the latest new orders data and S&P Global’s UK Construction Purchasing Managers’ Index suggest there’s room for greater demand to stimulate confidence and activity throughout the supply chain.
The tax reforms expected in the upcoming Autumn Budget could compound the situation by increasing the cost of producing cement for domestic suppliers – risking a greater national reliance on imports.
According to MPA, cement imports have nearly tripled in the last 20 years(4).
DBT data supports this, showing that in 2024, more than £330 million worth of Portland cement – the most commonly used variety of cement – was imported by the UK. This was almost triple the annual value imported in 2016, when readily available import data from the DBT starts.
Reliance on imports largely comes down to cost. UK cement producers face high electricity prices and carbon taxation that puts them at a disadvantage in comparison to some international competitors.
The cost of power
Since Russia invaded Ukraine in early 2022, British electricity prices have remained at historically high levels.
According to the latest data from the Department for Energy Security and Net Zero (DESNZ), average annual electricity prices increased by over 50% in 2024 on 2019 for British manufacturers of all consumption sizes(5).
In some cases, prices almost doubled.
This is regardless of consumer size and excluding the Climate Change Levy (CCL) – an environmental tax that some UK businesses pay for using certain fuels, from which cement manufacturers are largely exempt(6).
In the 30 years since 1994, prices more than tripled for most manufacturers, and rose by over 250% for extra-large consumers (those consuming more than 150,000 megawatt hours of electricity annually).
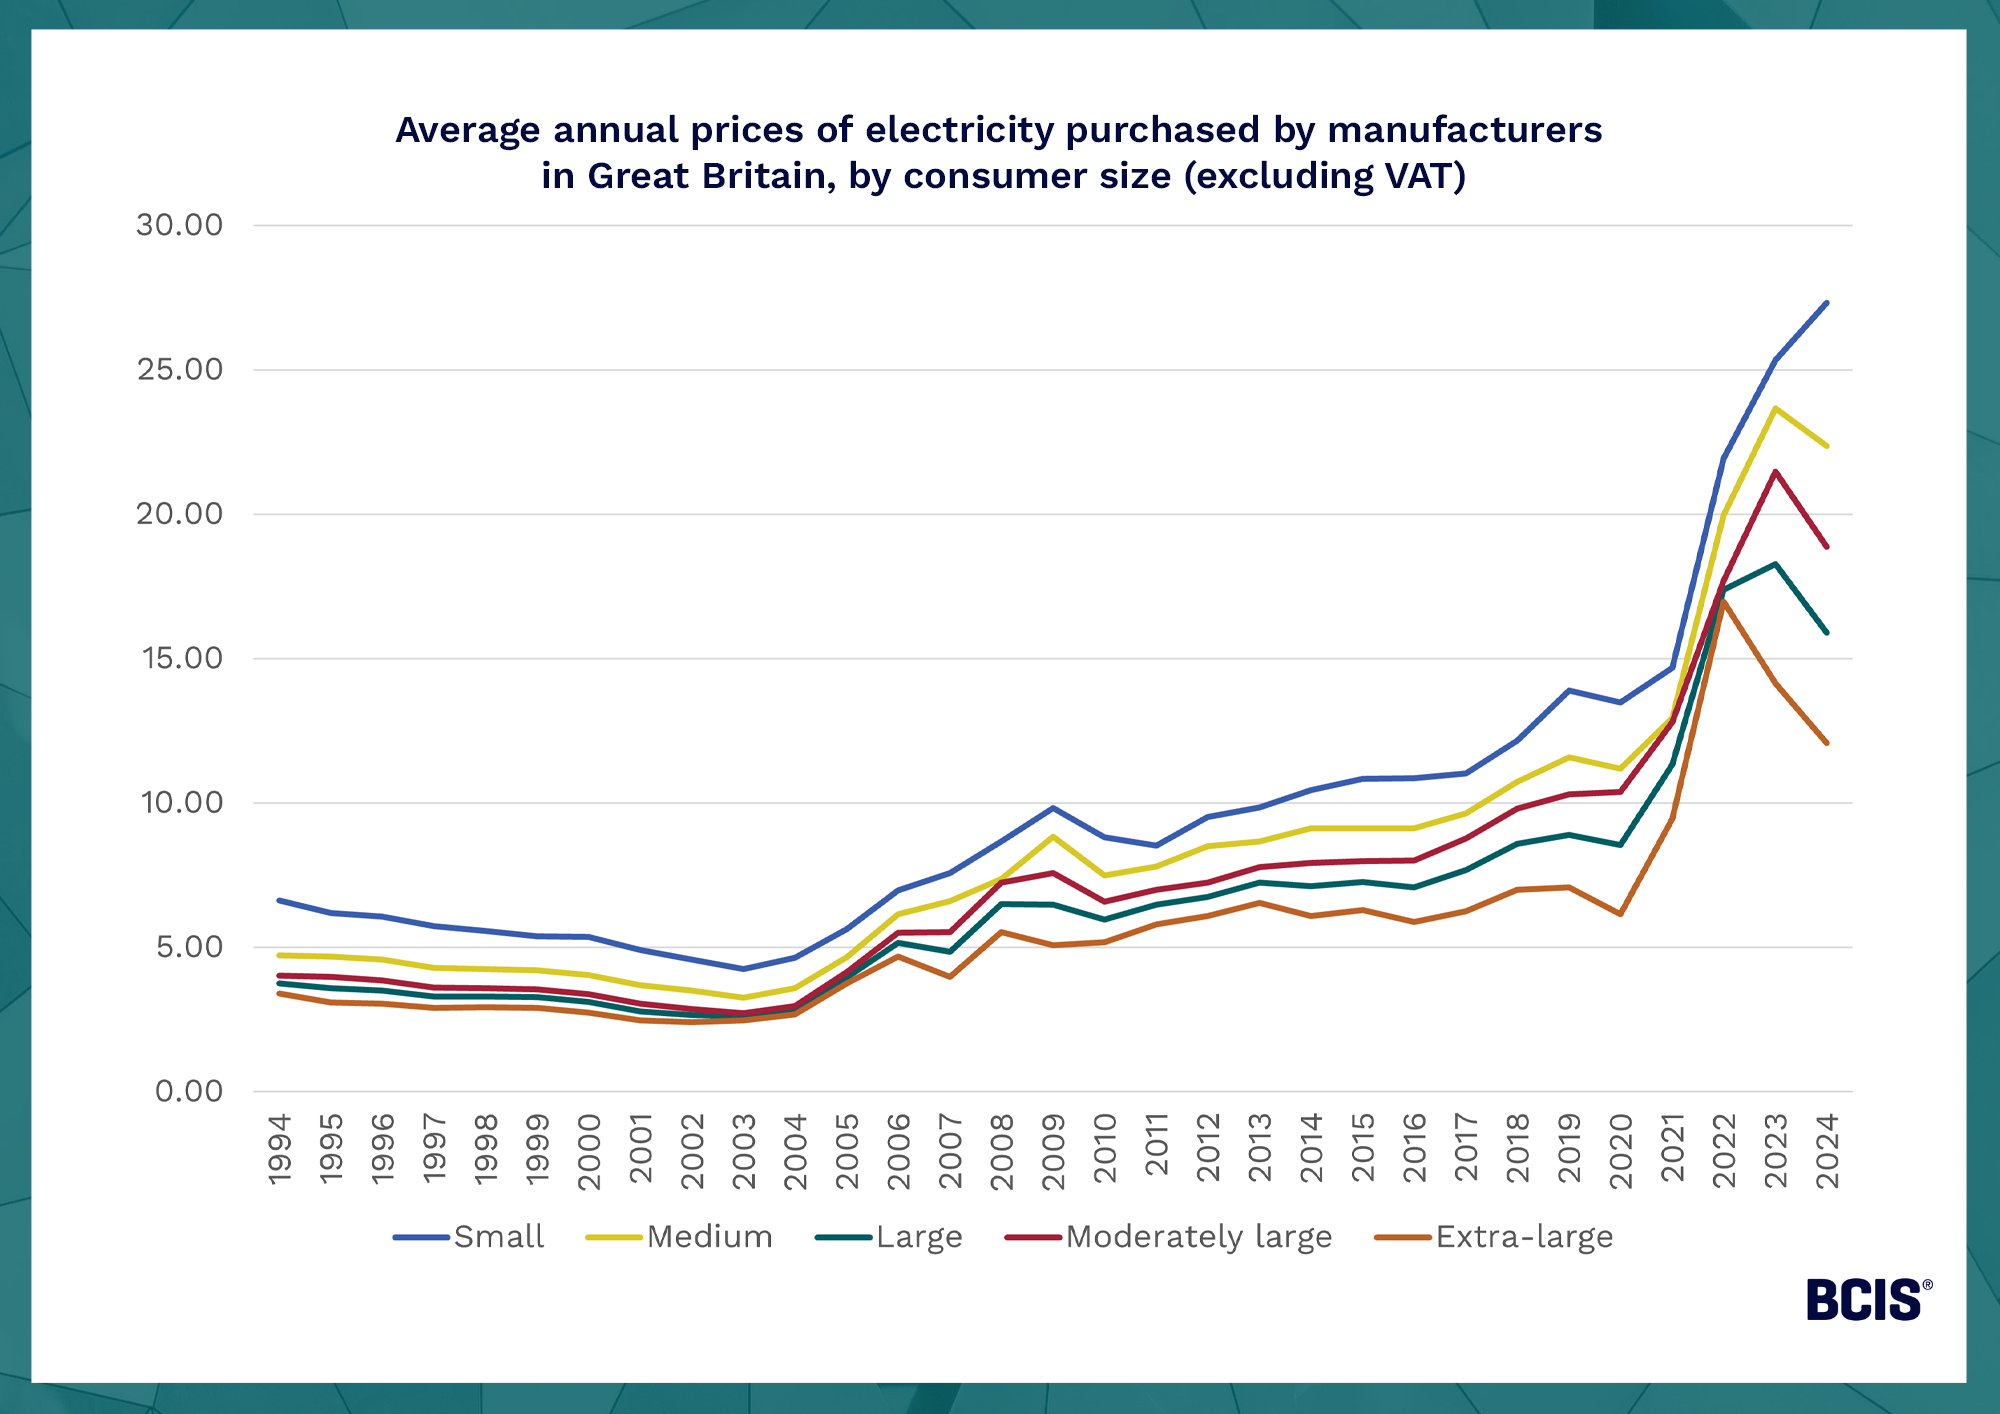
Source: Department for Energy Security and Net Zero – Prices of fuels purchased by manufacturing industry, table 3.1.3.
The impact of this on output has been tangible.
Government analysis shows that between 1Q2021 and 4Q2024, a period defined by rapidly increasing electricity and gas prices, the volume of output in the manufacture of inorganic, non-metallic products fell by almost one-third (30%)(7). This included the manufacture of cement, lime, plaster and articles of concrete, cement and plaster.
Promisingly, the government seems keen to address the issue, revealing plans to cut energy prices in the UK’s Modern Industrial Strategy.
From 2027, up to 7,000 businesses could see their electricity costs cut by as much as 25%, or £40 per megawatt hour, under the new British Industrial Competitiveness Scheme(8).
The government has also pledged to cover more of the electricity network charges paid by the most energy-intensive firms via the British Industry Supercharger scheme – an initiative that reduces electricity costs for energy-intensive industries (EIIs) through compensations and exemptions.
Once implemented, these plans could be transformative for cement manufacturers, providing they’re deemed eligible, which won’t be revealed until further consultation takes place.
However, these solutions, akin to the government’s renewable energy drive to improve energy security and lower costs in the UK, are long-term fixes to an immediate problem.
As the nation’s most expensive energy source, and due to marginal cost pricing, gas sets the price of electricity in the UK.
Electricity prices are effectively tied to the international gas market, which can be incredibly volatile and led to high electricity prices in the UK years before the conflict in Ukraine began.
Further, there’s evidence to suggest that UK manufacturers pay more for their electricity than a large proportion of their EU counterparts.
According to Eurostat data, between 2009 and pre-Brexit 2019, the average annual electricity prices for non-household consumers in the UK (i.e. medium-sized consumers with an annual consumption between 500 and 2,000 megawatt hours) were broadly higher than the average annual prices seen in a mean of 28 EU countries(9).
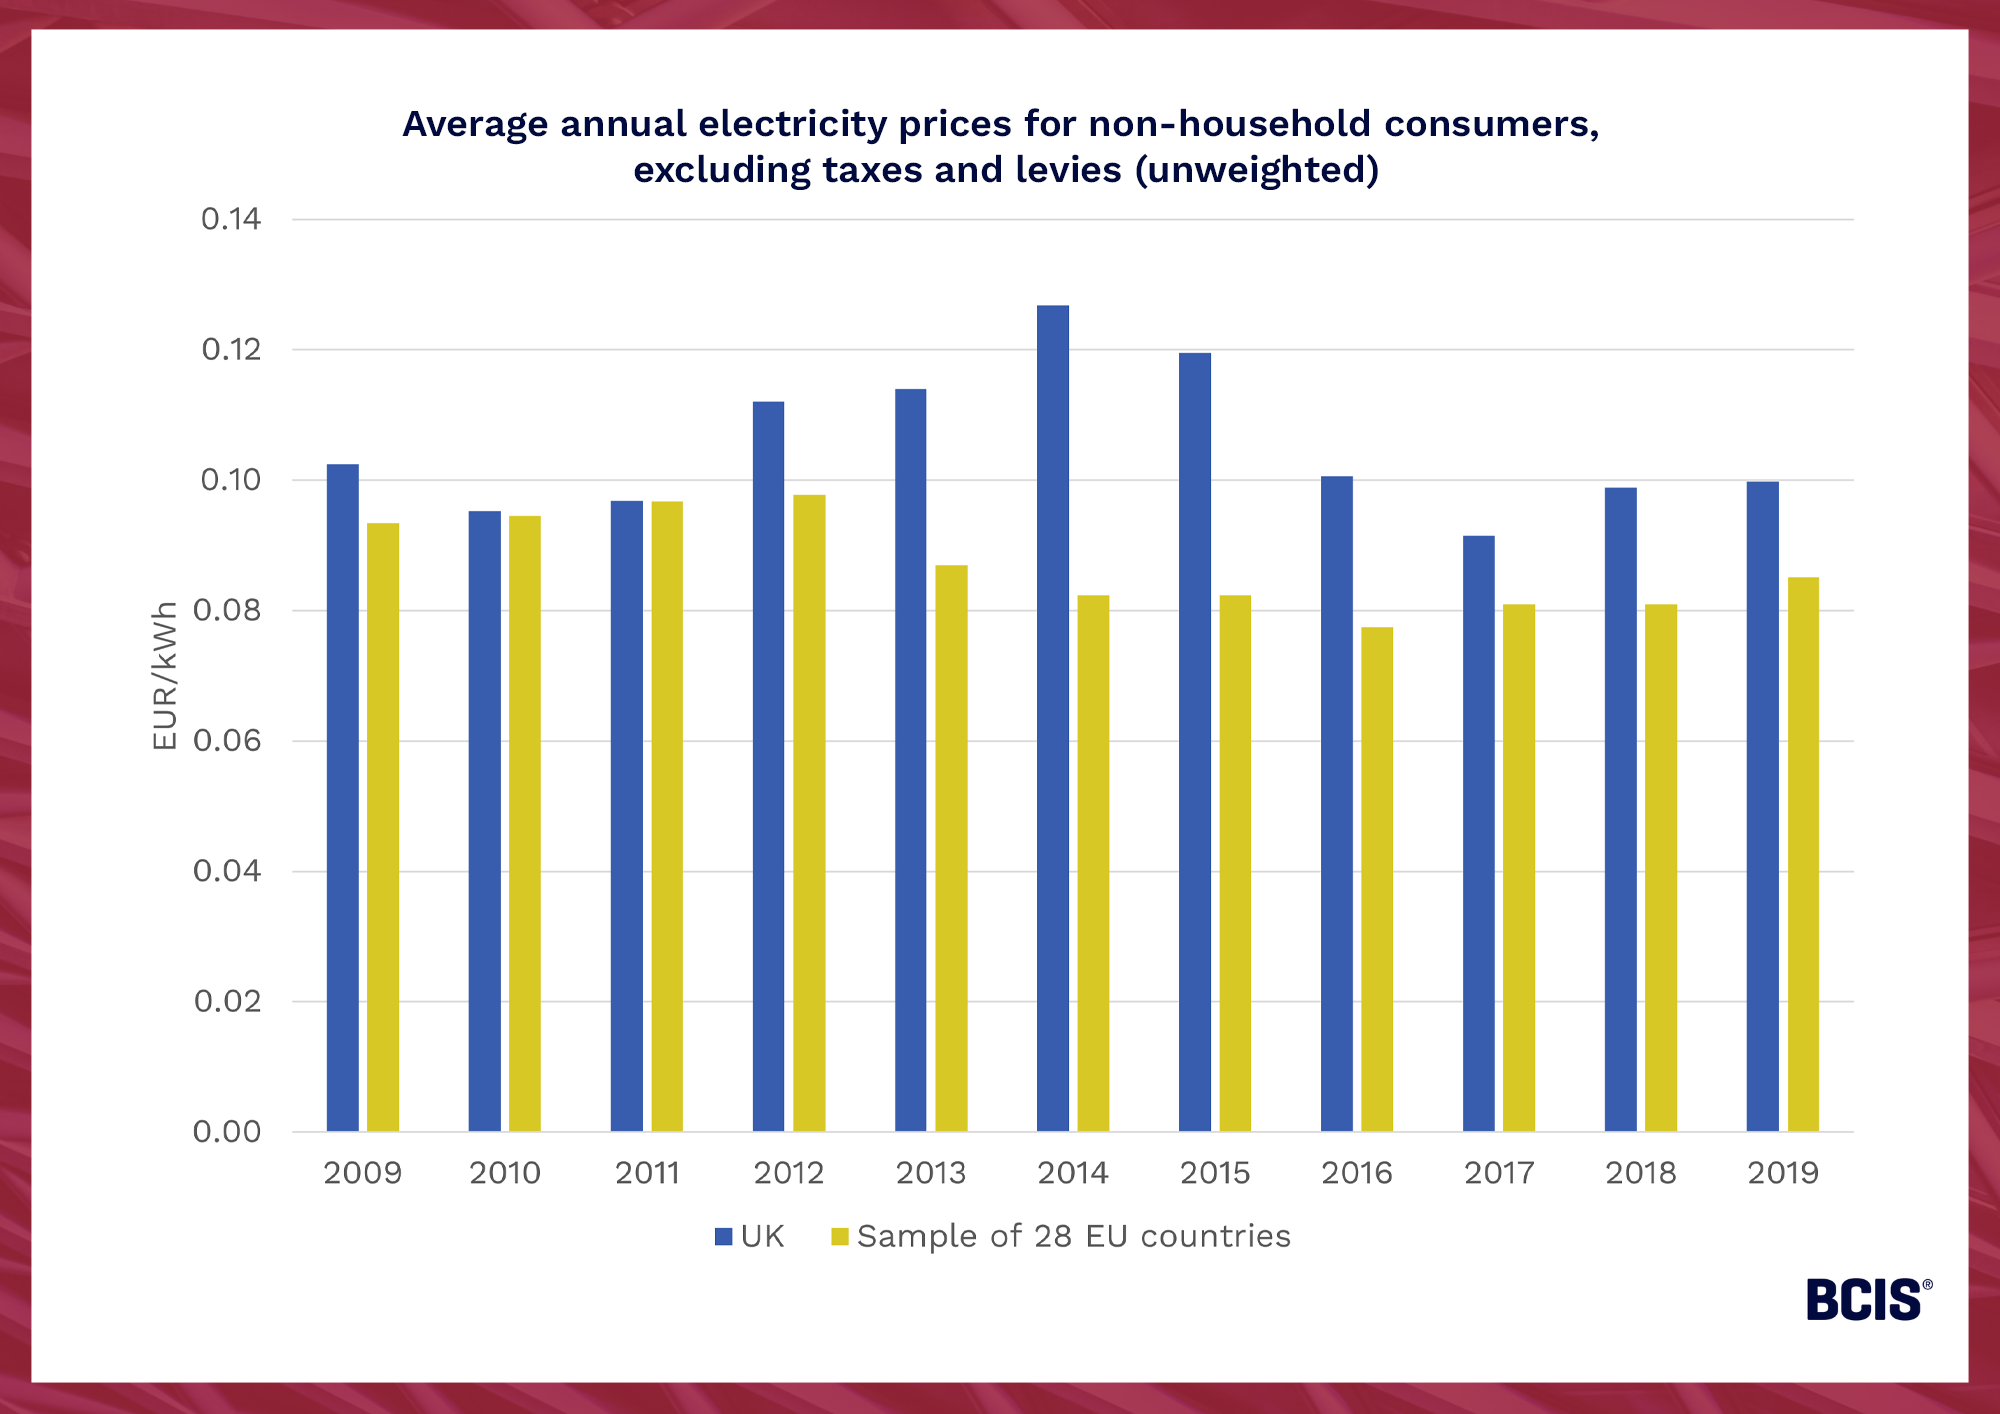
Source: Eurostat – Electricity prices for non-household consumers – bi-annual data (from 2007 onwards). Average annual prices used in the above chart are the mean of two bi-annual values for each country, unweighted for consumption and excluding taxes and levies. For the EU sample, an average of the annual prices for each country is used.
While this comparison must be taken with a pinch of salt as it does not account for weighted prices where consumption and seasonal variations between countries are considered, it hints at the UK’s disproportionate vulnerability to the international gas market.
A more nuanced comparison using EU countries whose non-metallic mineral industries (i.e. cement manufacturers) share a similar electricity consumption to the UK(10), supports this thinking.
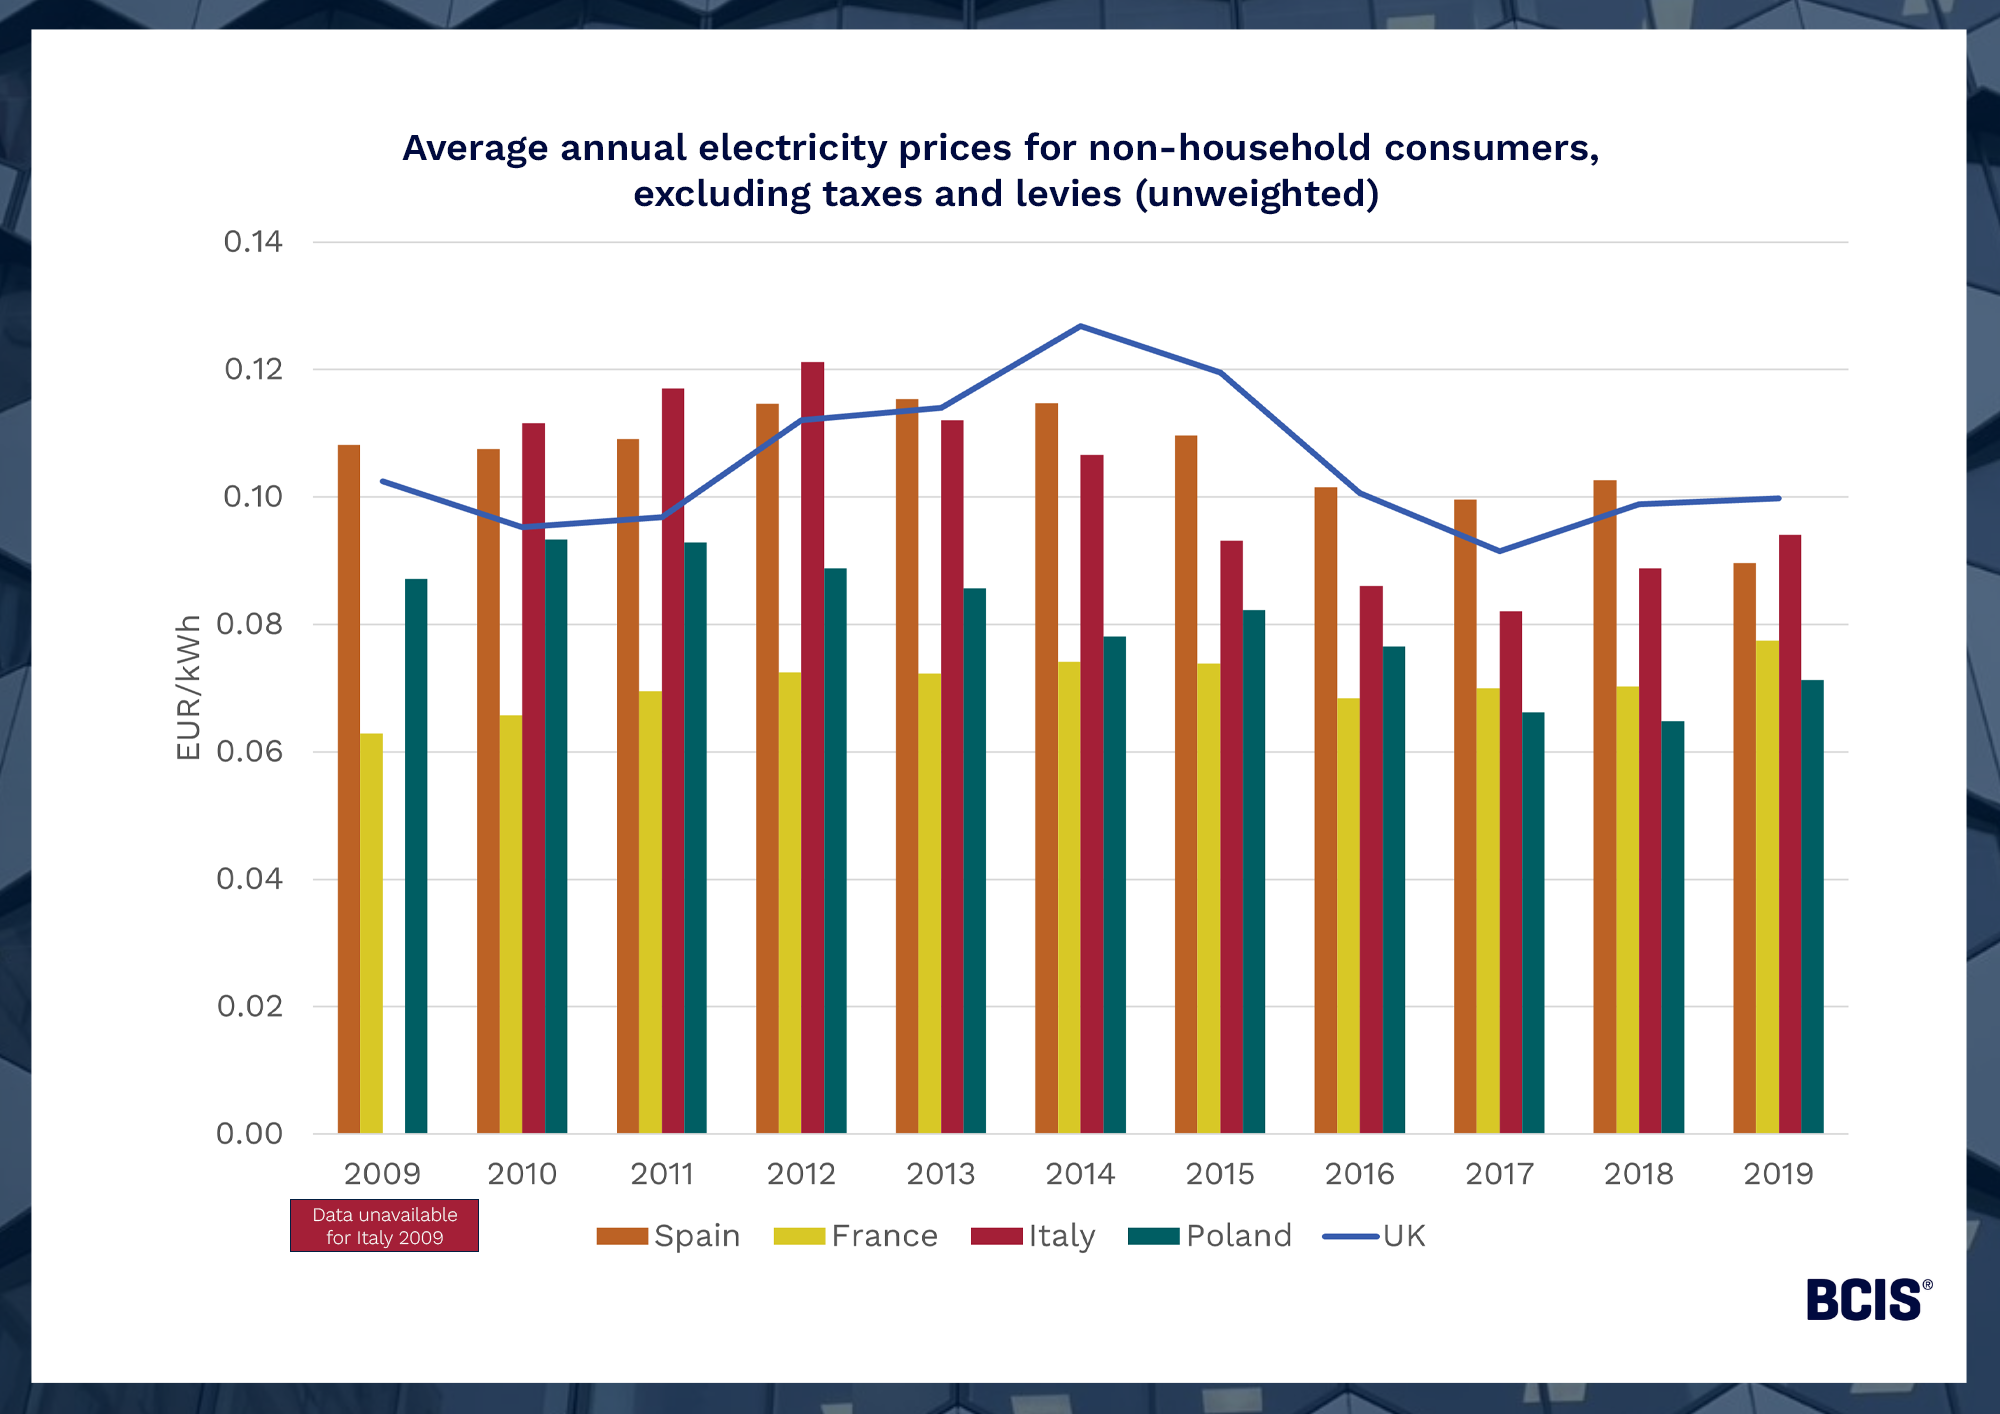
Source: Eurostat – Electricity prices for non-household consumers – bi-annual data (from 2007 onwards). Average annual prices used in the above chart are the mean of two bi-annual values for each country, unweighted for consumption and excluding taxes and levies.
Between 2009 and pre-Brexit 2019, average annual electricity prices for non-household consumers in the UK were higher than those paid by counterparts in Spain, France, Italy and Poland 36% of the time.
This was a higher proportion than any other country in the sample except for Spain.
While this isn’t a direct comparison of electricity prices between cement manufacturers, it suggests that UK manufacturers of non-metallic minerals faced higher electricity prices than their comparable counterparts in the 11 years ending in 2019.
Fundamentally, there’s no easy answer to boosting domestic cement production.
Past and present energy cost relief schemes have reduced some of the burden, but not at the rate required to make the domestic cement market competitive.
The British Industrial Competitiveness Scheme will be welcome, but 2027 is still a long way off and there’s a risk that conditions will become worse for producers before further support is available.
That said, the government’s infrastructure strategy is cause for optimism.
Infrastructure work creates significant demand for cement and the sheer volume of projects in the pipeline could be transformative for the domestic industry.
The key will be in attracting private sector investment to stimulate demand.
If the government can achieve this and reconsider its stance on business tax in the Autumn Budget to lower costs for producers, the future of UK cement will be all the stronger.
To keep up to date with the latest industry news and insights from BCIS, register for our newsletter here.
(1) MPA – Government building plans at risk as UK cement production falls to 75-year low – here
(2) GOV.UK – Building materials and components statistics: August 2025 – here
(3) GOV.UK – Building materials and components statistics: August 2025 – here
(4) MPA – Government building plans at risk as UK cement production falls to 75-year low – here
(5) GOV.UK – Prices of fuels purchased by manufacturing industry – here
(6) GOV.UK – Climate Change Levy ― reliefs and special treatments for taxable commodities (Excise Notice CCL1/3) – here
(7) Office for National Statistics – The impact of higher energy costs on UK businesses: 2021 to 2024 – here
(8) GOV.UK – Powering Britain’s future: Electricity bills to be slashed for over 7,000 businesses in major industry shake-up – here
(9) Eurostat – Electricity prices for non-household consumers – bi-annual data (from 2007 onwards) – here
(10) Eurostat – Supply, transformation and consumption of electricity – here
Share on social media
![]()