The Building Cost Information Service (BCIS) is the leading provider of cost and carbon data to the UK built environment. Over 4,000 subscribing consultants, clients and contractors use BCIS products to control costs, manage budgets, mitigate risk and improve project performance. If you would like to speak with the team call us +44 0330 341 1000, email contactbcis@bcis.co.uk or fill in our demonstration form
Published: 25/11/2025
Each year, the government publishes the number of net additions made to the housing supply in England, i.e. the increase when taking new build completions, conversions, change of use and demolitions into account. These are based on local authority estimates of gains and losses of dwellings during each year and are calculated using the most comprehensive list of sources available. This includes the council tax base, building control, site visits and any other management information available to the local authority.
The publication of weekly domestic Energy Performance Certificate (EPC) lodgements also enables the government to estimate more recent net additional dwellings figures.
Annual decrease in growth of England’s housing supply for third year running
England’s housing supply increased by 208,600 in the 2024/25 financial year, according to the latest data published by the Ministry of Housing, Communities & Local Government (MHCLG)(1). This represented a 6% decrease on the additions in the previous year (221,409) and is the third consecutive year that the growth in the number of additions has declined.
Further, EPC registrations up to 9 November show an estimated 124,800 net additional homes were delivered in England between 1 April 2025 and 9 November 2025.
In total, MHCLG said an estimated 275,600 net additional homes have been delivered in England so far in this Parliament (since 9 July 2024).
Dr David Crosthwaite, chief economist at BCIS, said: ‘The latest figures underline the scale of the challenge facing the government. With net additions falling for the third consecutive year, delivery is moving further away from where it needs to be. On the current trajectory, we are looking at something closer to 1 million homes over the Parliament, rather than the 1.5 million that has been promised.
‘The estimate that 124,800 net additions have been delivered so far this financial year would put England on course for roughly 204,000 homes in 2025/26 (seasonal differences excepted), which is further evidence that not enough is happening on the ground to change the direction of travel.
‘This is a self-imposed target, and the emerging shortfall is becoming increasingly self-inflicted. The longer it takes for demand to stimulate housebuilding beyond current suppressed levels, the larger the delivery burden becomes later in the Parliament, and it is nigh on impossible to see how those numbers could realistically be achieved.’
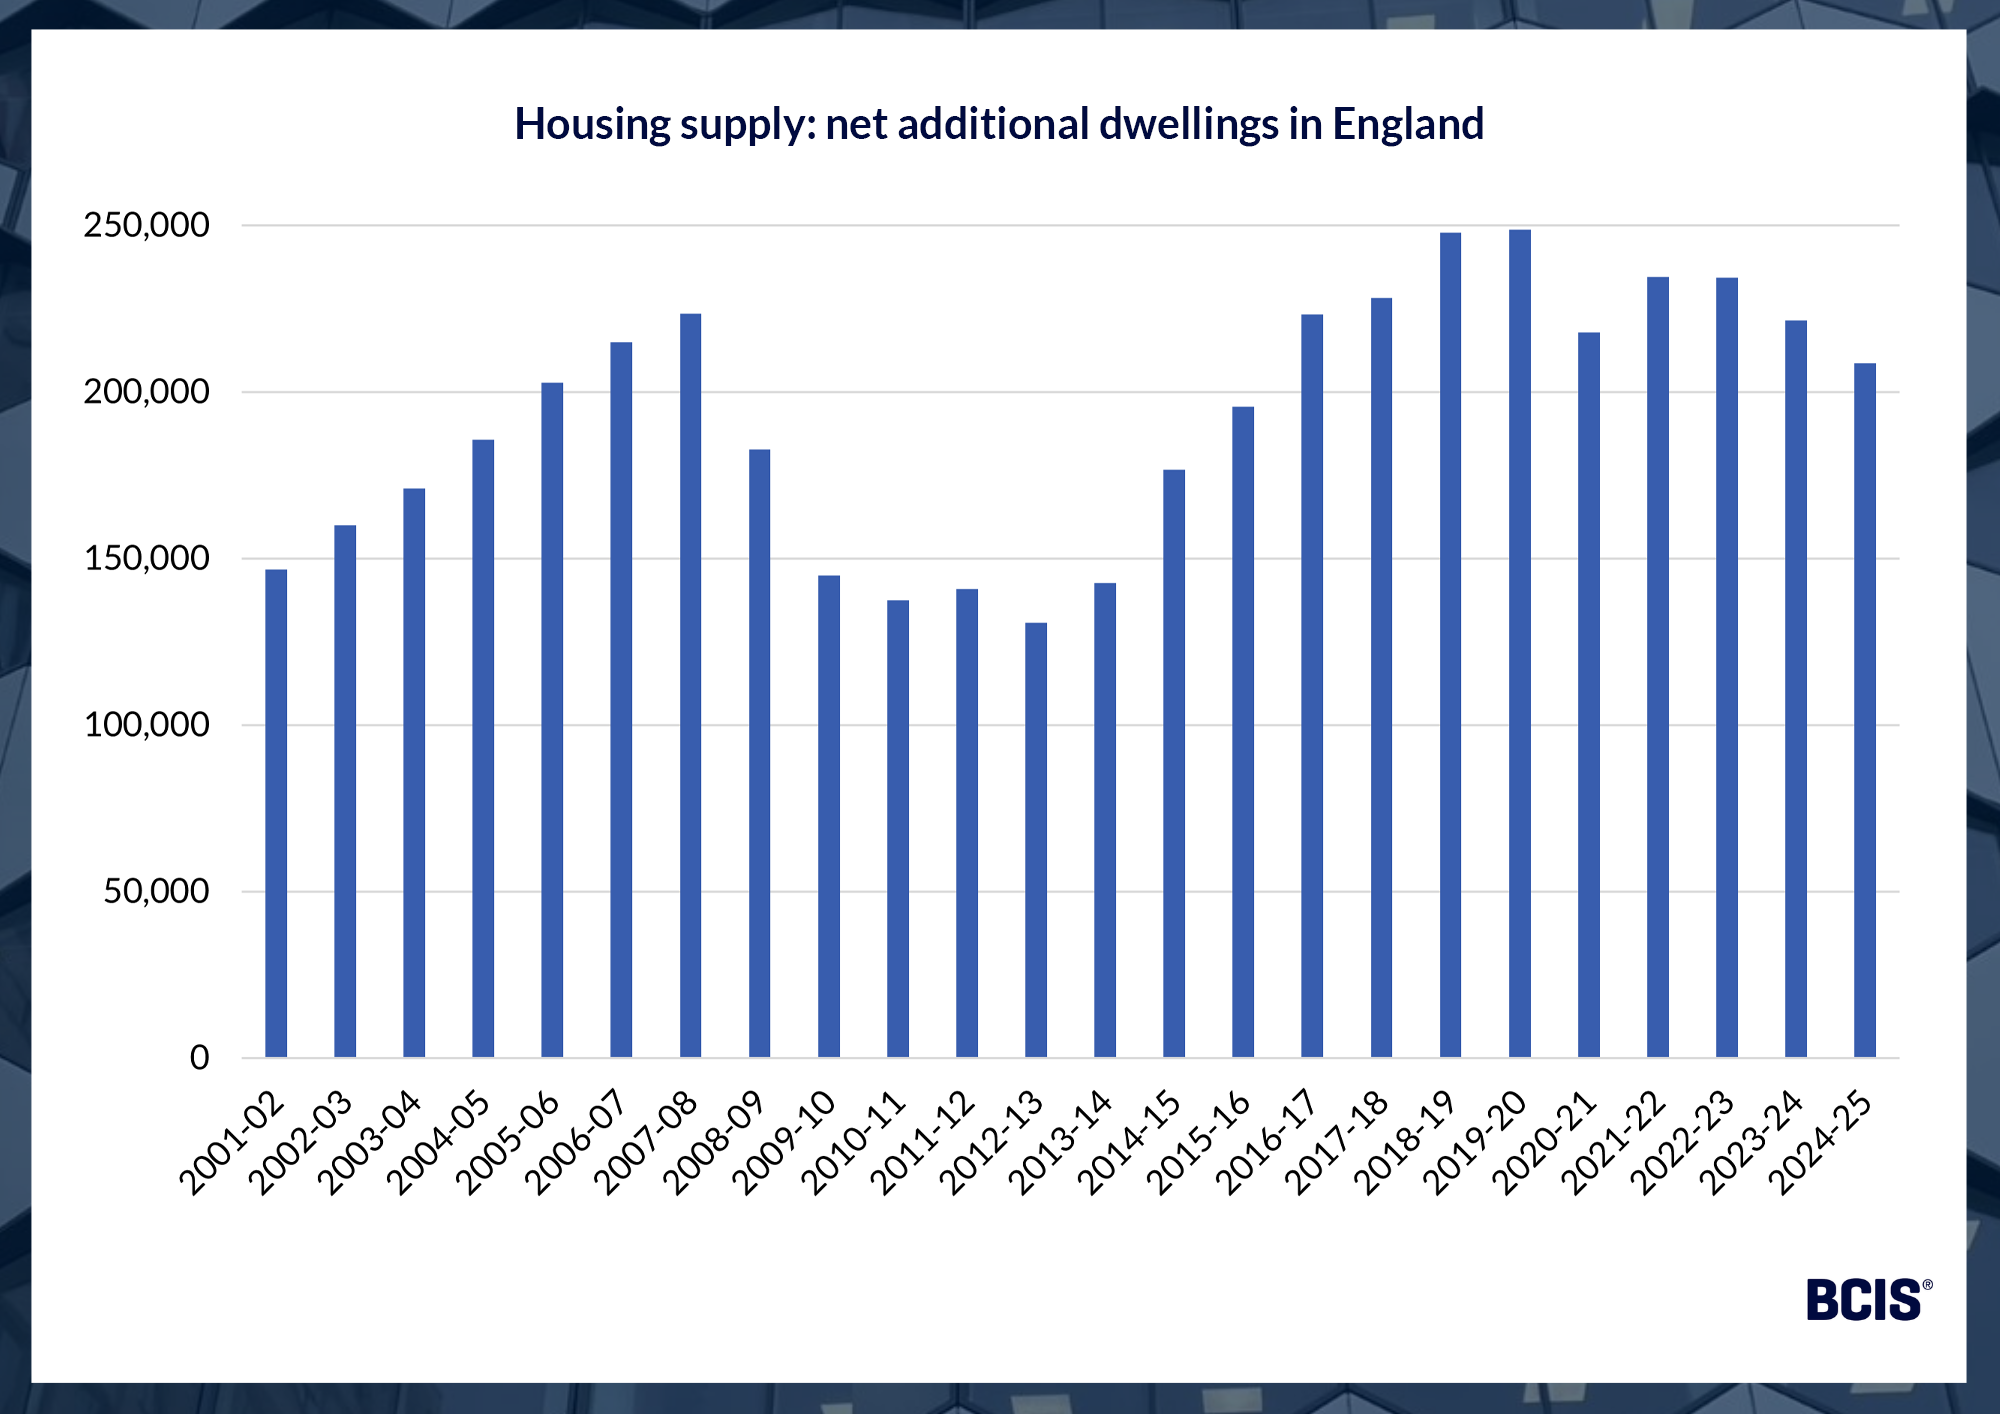
Source: Ministry of Housing, Communities & Local Government
On a regional basis, net additions per 1,000 dwellings in 2024/25 ranged from 6.54 in the North East to 9.71 in the East Midlands. By local authority, the lowest rate of net additions per 1,000 dwellings was in Castle Point, Essex (0.54) while the greatest was in Tewkesbury, Gloucestershire (31.23).
Greater London, which has seen headlines over depressed housing activity in recent months, features at both ends of the local authorities table, from a rate of 20.71 in Newham and 18.60 in Barking and Dagenham, to just 1.00 in Richmond upon Thames and 1.16 in the City of London.
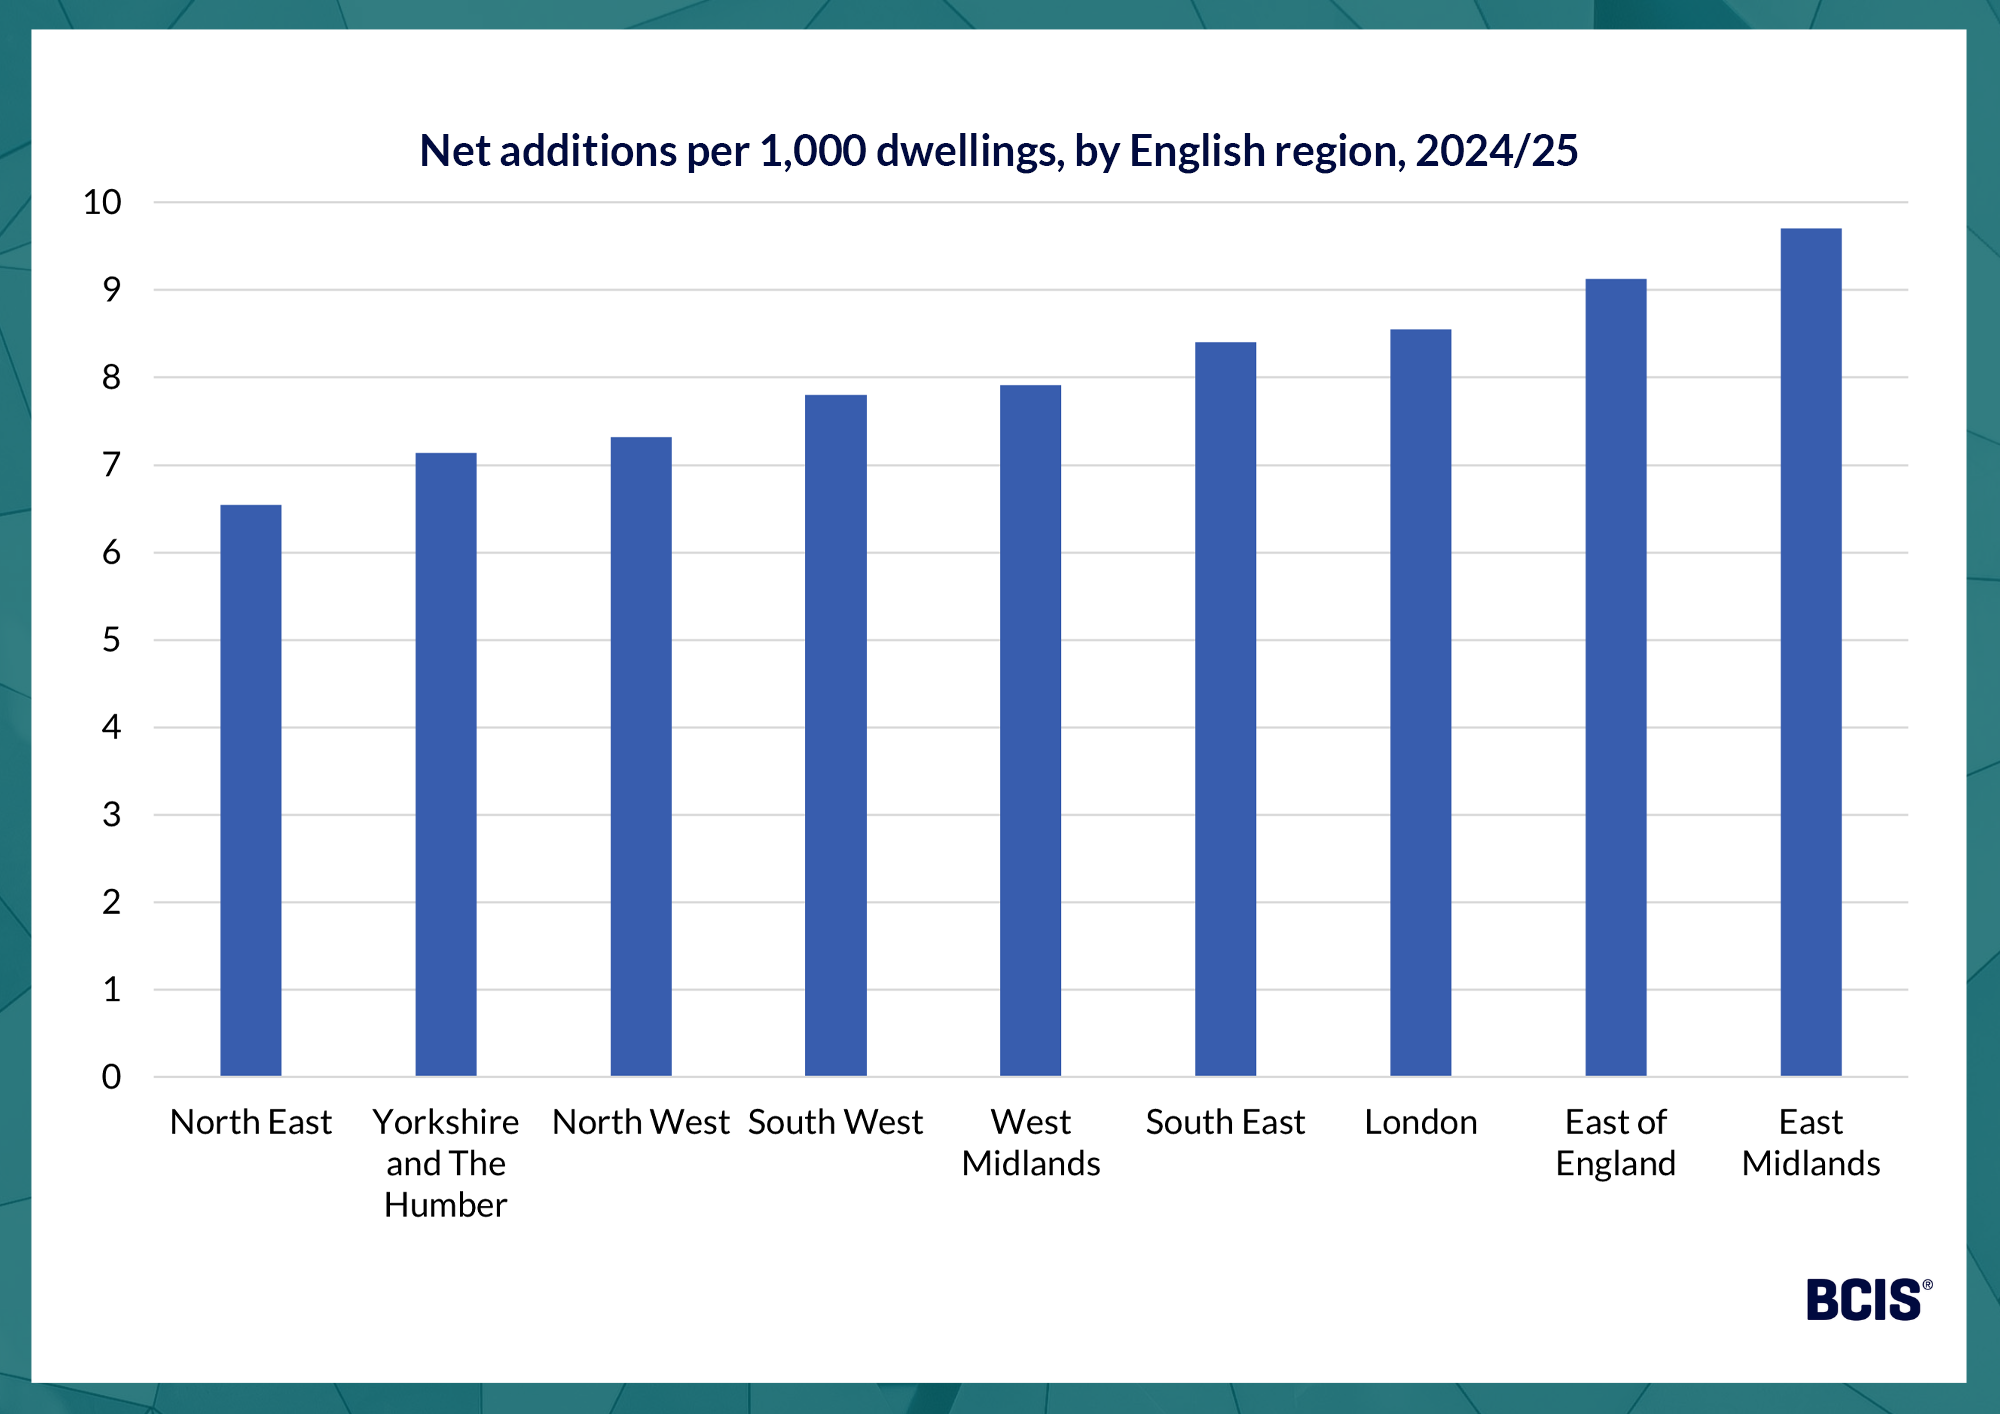
Source: Ministry of Housing, Communities & Local Government
To keep up to date with the latest industry news and insights from BCIS, register for our newsletter here.
(1) GOV.UK – Housing supply: net additional dwellings, England: 2024 to 2025 – here
Share on social media
![]()