BCIS’s Life cycle evaluator can be used to produce fully compliant whole life carbon assessments.
The tool enables users to understand the combined cost and carbon impact of projects and see where improvements can be made.
Login to access the BCIS online service.
LoginPublished: 28/10/2025
The Office for National Statistics (ONS) releases datasets that measure the impact of economic activity on the environment each year(1). This data is updated under the ONS’s UK Environmental Accounts and provide figures back to 1990.
Data used in the story below covers scope 1 emissions, which refer to emissions from sources that residents and registered businesses in the UK own or directly control. Scope 2 emissions refer to those indirectly produced from the generation of purchased energy, while scope 3 emissions cover all other indirect emissions that occur in producing and transporting goods and services, including the full supply chain(2).
The National Atmospheric Emissions Inventory (NAEI) is the main source for air emissions data reported in the UK Environmental Accounts. Air emissions data is calculated from activity data (e.g. kilometres driven by cars) and emissions factors (e.g. the emission factor of diesel) with the residence principle applied(3).
Greenhouse gas (GHG) emissions produced by the UK construction sector in 2024 were 30.3% higher than in 1994, new provisional data from the ONS has shown.
More than 11 million tonnes of carbon dioxide equivalent (CO2e) were emitted from sources directly owned or controlled by residents and registered businesses in the sector last year (known as scope 1 emissions) – 2.6 million more tonnes than the annual level emitted three decades ago.
This was the third largest 30-year rise of all sectors measured, behind real estate activities (35.6%) and accommodation and food services (36.1%).
By comparison, scope 1 GHG emissions generated across the whole UK economy fell by 40.7% in the same period.
On the year, construction’s GHG emissions rose by 1.8% and by 16.9% on 2014.
James Fiske, BCIS’s executive director and Chair of the Built Environment Carbon Database, said: ‘The fact that construction’s emissions, and its dependence on fossil fuels, are both rising speaks to the urgent need for whole life carbon thinking.
‘The government is taking action on operational carbon, but emissions generated before a building is in use – from product manufacture to construction – and during demolition, are wildly unregulated. Without standardised, whole life carbon reporting, the construction sector cannot decarbonise.’
Data published by the ONS in June 2025 revealed an updated breakdown of GHG emissions by work type in construction in 2023.
| Areas of work | 2023 GHG emissions compared with | ||
| 2013 | 2003 | 1993 | |
| All construction | 11.9% | 8.4% | 33.6% |
| Buildings and building construction works | 5.0% | -6.5% | 12.9% |
| Constructions and construction works for civil engineering | 21.0% | 7.4% | 21.5% |
| Specialised construction works | 7.3% | 17.7% | 62.8% |
Source: ONS – UK Environmental Accounts – Atmospheric emissions: greenhouse gases by industry and gas
The lion’s share derived from specialised construction works with 4.5 million tonnes of CO2e emitted, closely followed by constructions and construction works for civil engineering which emitted 4.4 million tonnes.
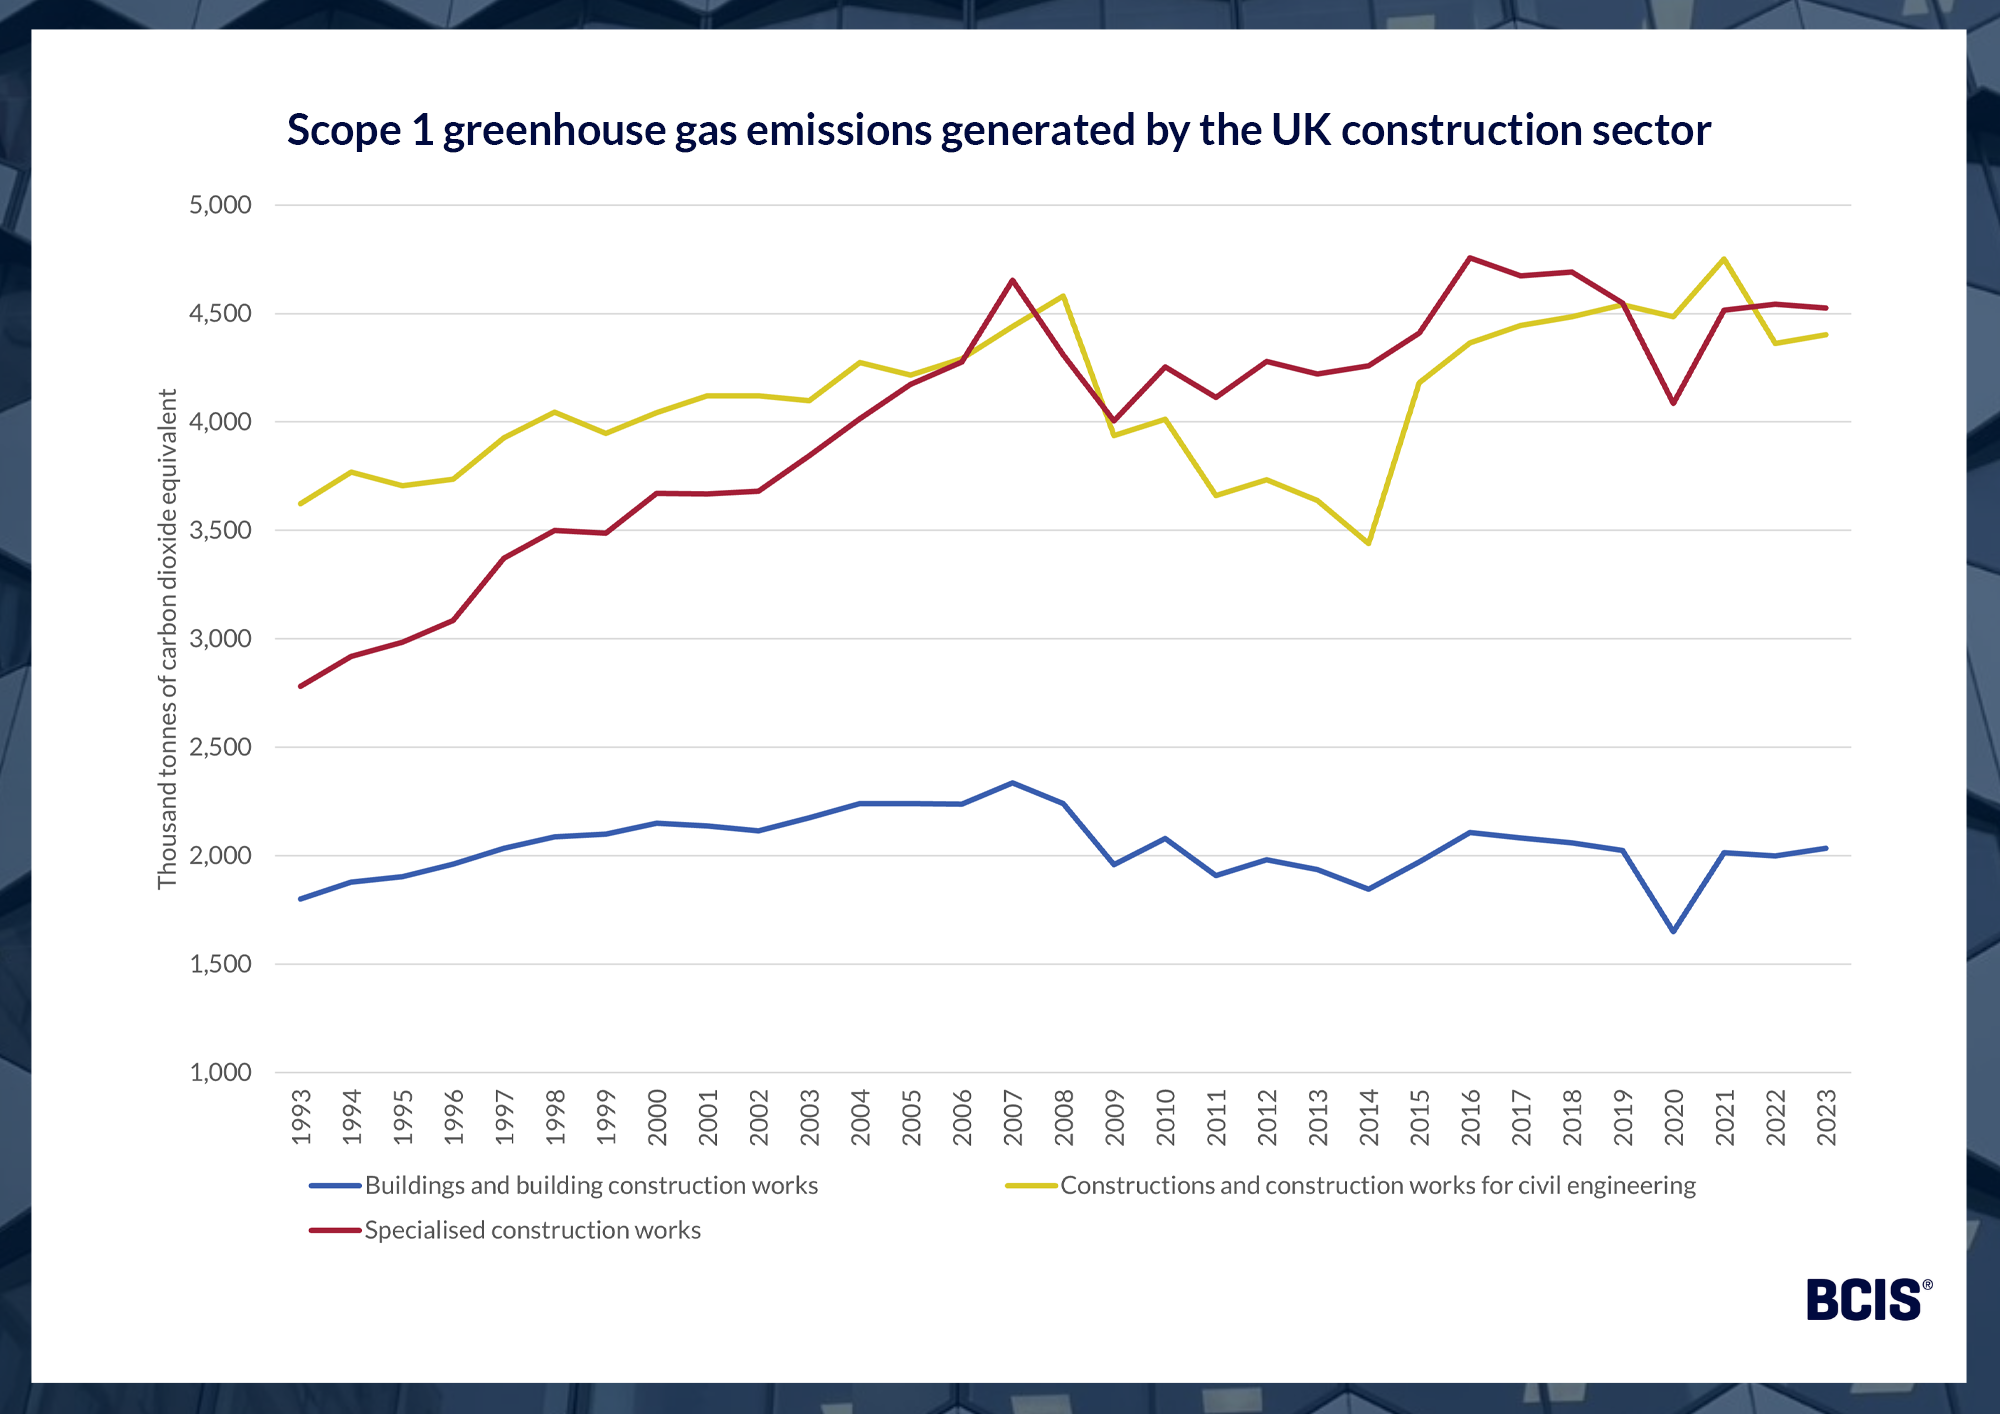
Source: ONS – UK Environmental Accounts – Atmospheric emissions: greenhouse gases by industry and gas
ONS data on GHG emissions uses scope 1 emissions that do not account for embodied carbon – emissions produced through the extraction, manufacture, transportation, use and demolition of building materials.
The Net Zero Whole Life Carbon Roadmap Progress Report, published by the UK Green Building Council in 2023, showed embodied carbon emissions fell by 4% between 2018 and 2022(4). This was less than the one-quarter reduction needed to stay on track for a net zero built environment by 2050.
Elsewhere, the ONS also provides data on fossil fuel usage by industry.
The latest figures show that in 2023, construction’s carbon-based fuel usage increased by 1.6% on the year and by just over one-quarter (25.1%) on 1993.
Looking at long-term trends, DERV (Diesel Engine Road Vehicle, referring to the white or road diesel used in transport) and gas oil are consistently the sector’s most used carbon-based fuels. This likely owes to the transportation of resources and personnel during construction projects.
Between 1993 and 2023, DERV usage in construction more than doubled, rising by 121.8%. In contrast, gas oil usage fell by 14.3% in the same period.
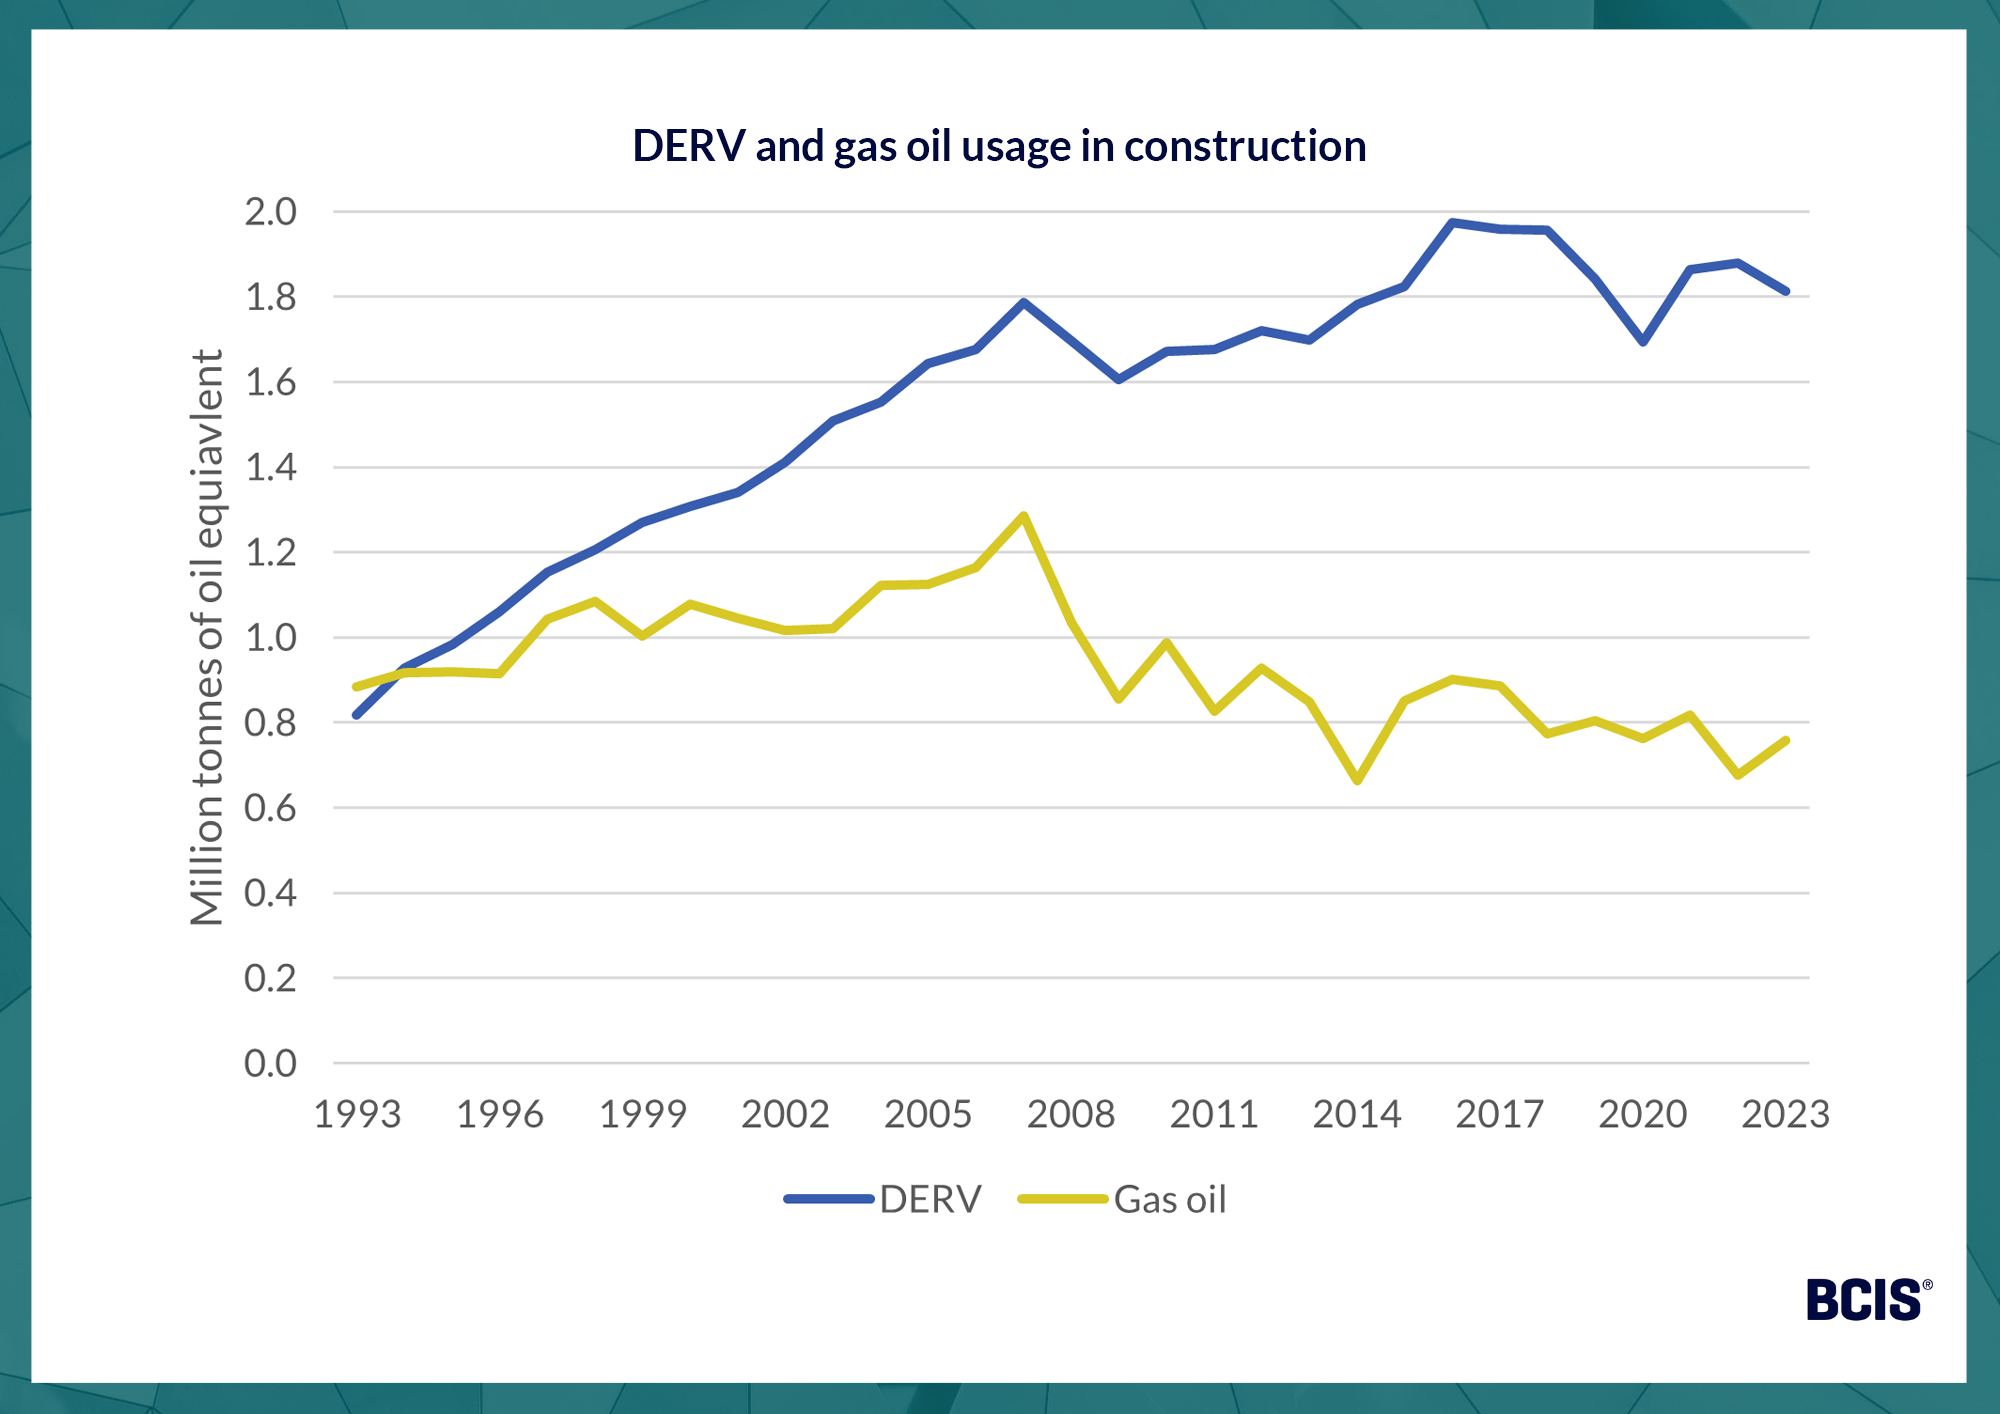
Source: ONS – UK Environmental Accounts – Energy use: fossil fuels by fuel type and industry
While the available figures point to construction’s growing reliance on fossil fuels, ONS data also show the sector’s shift towards greener energy.
In 2023, construction’s energy consumption from renewable and waste sources was over 80 times higher than in 1993 and more than triple the consumption seen in 2013.
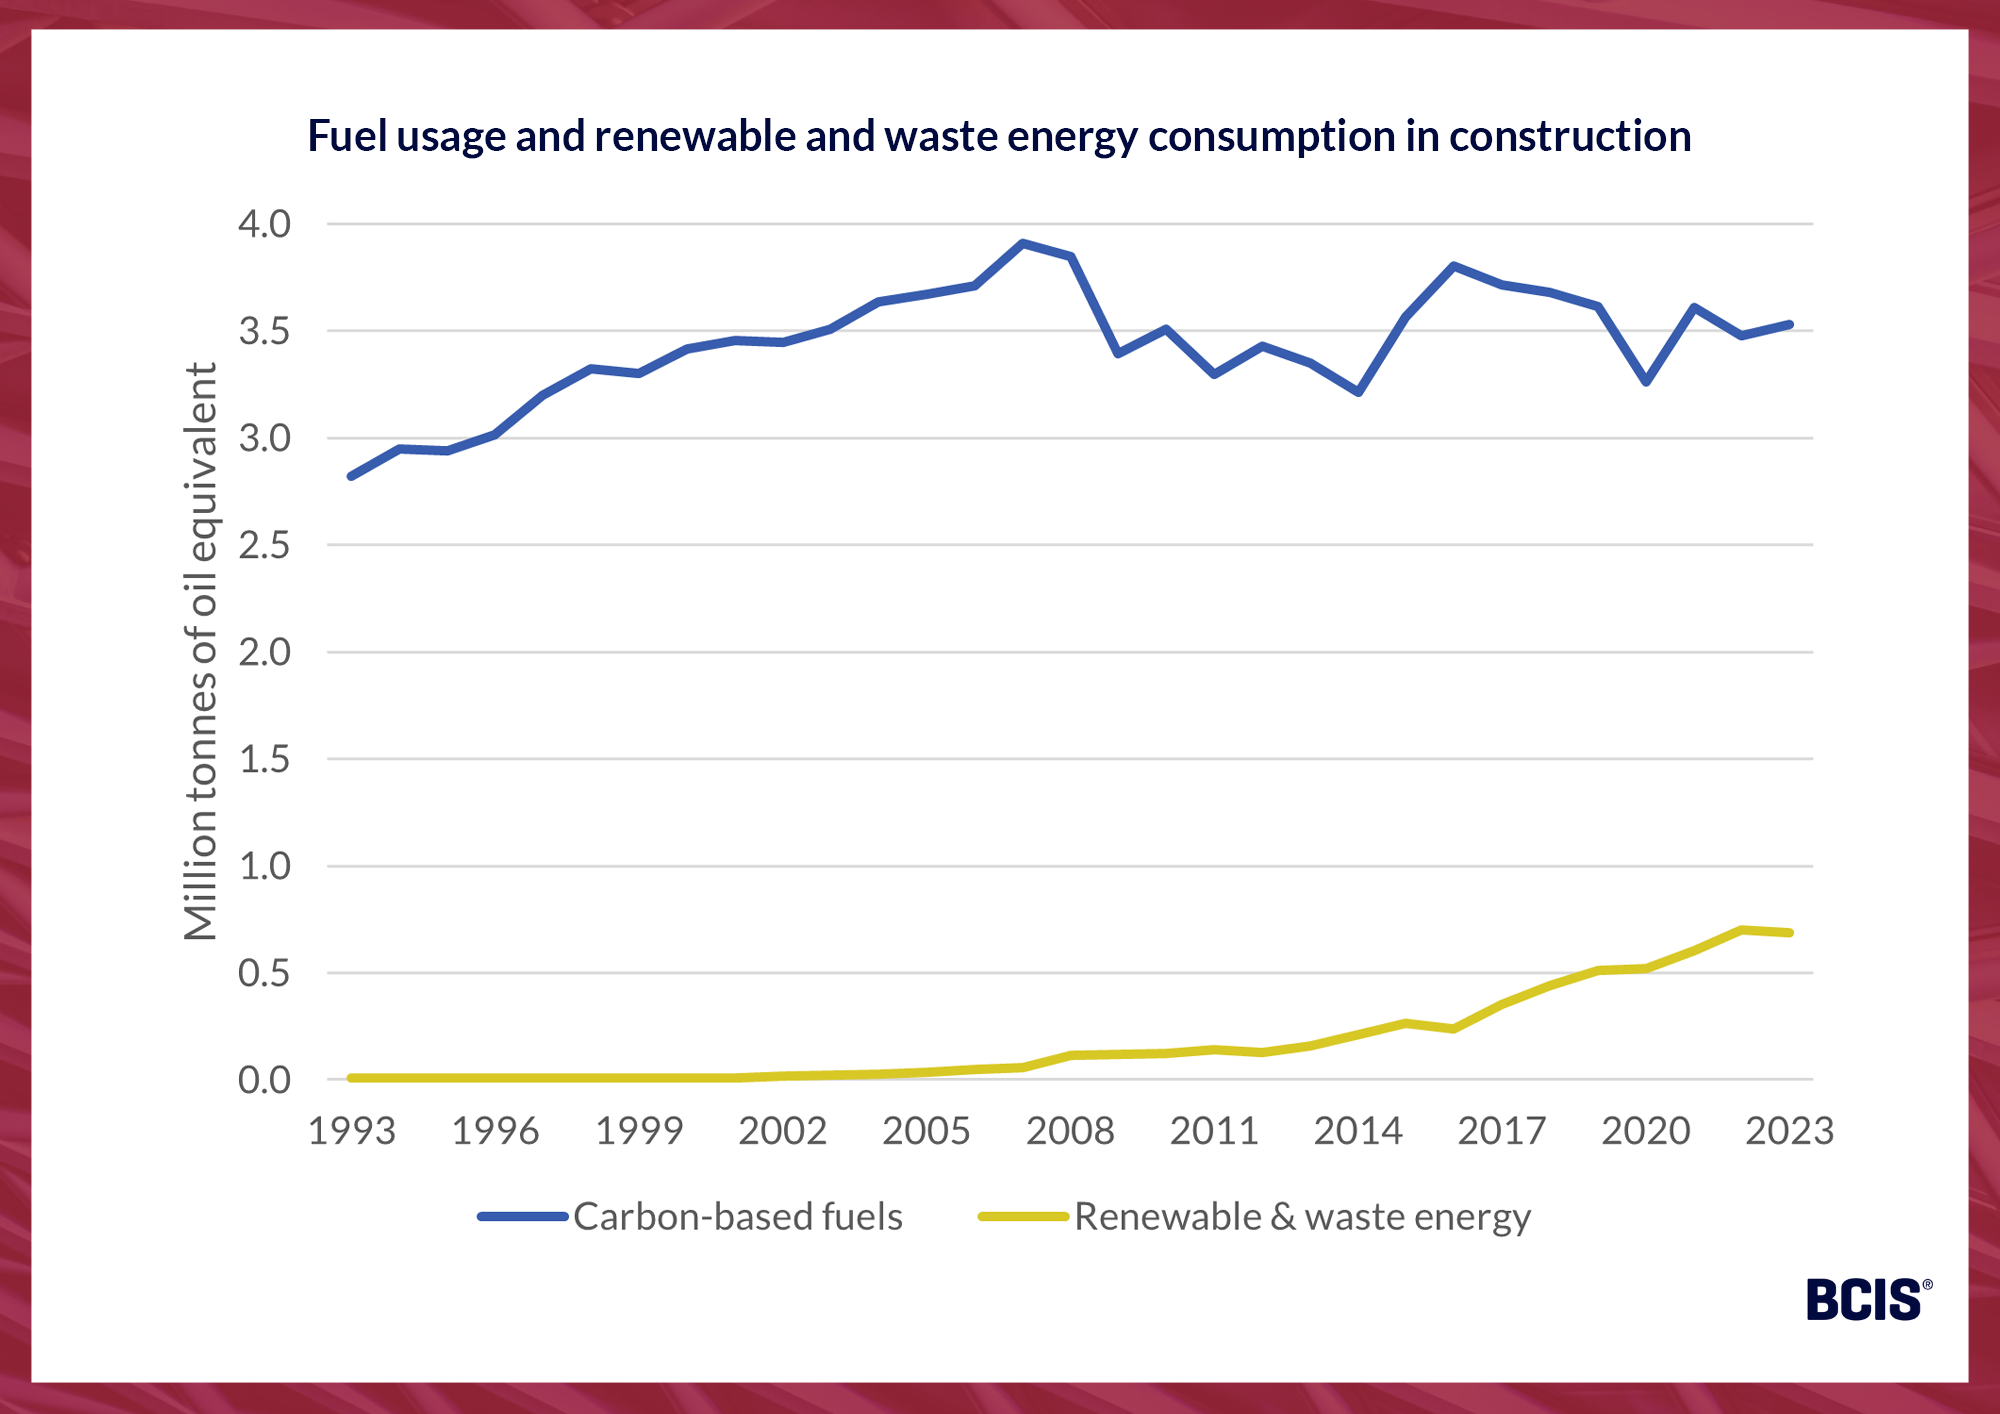
Source: ONS – UK Environmental Accounts – Energy use: fossil fuels by fuel type and industry & Energy use: renewable and waste sources
To keep up to date with the latest industry news and insights from BCIS, register for our newsletter here.
BCIS’s Life cycle evaluator can be used to produce fully compliant whole life carbon assessments.
The tool enables users to understand the combined cost and carbon impact of projects and see where improvements can be made.
![]()